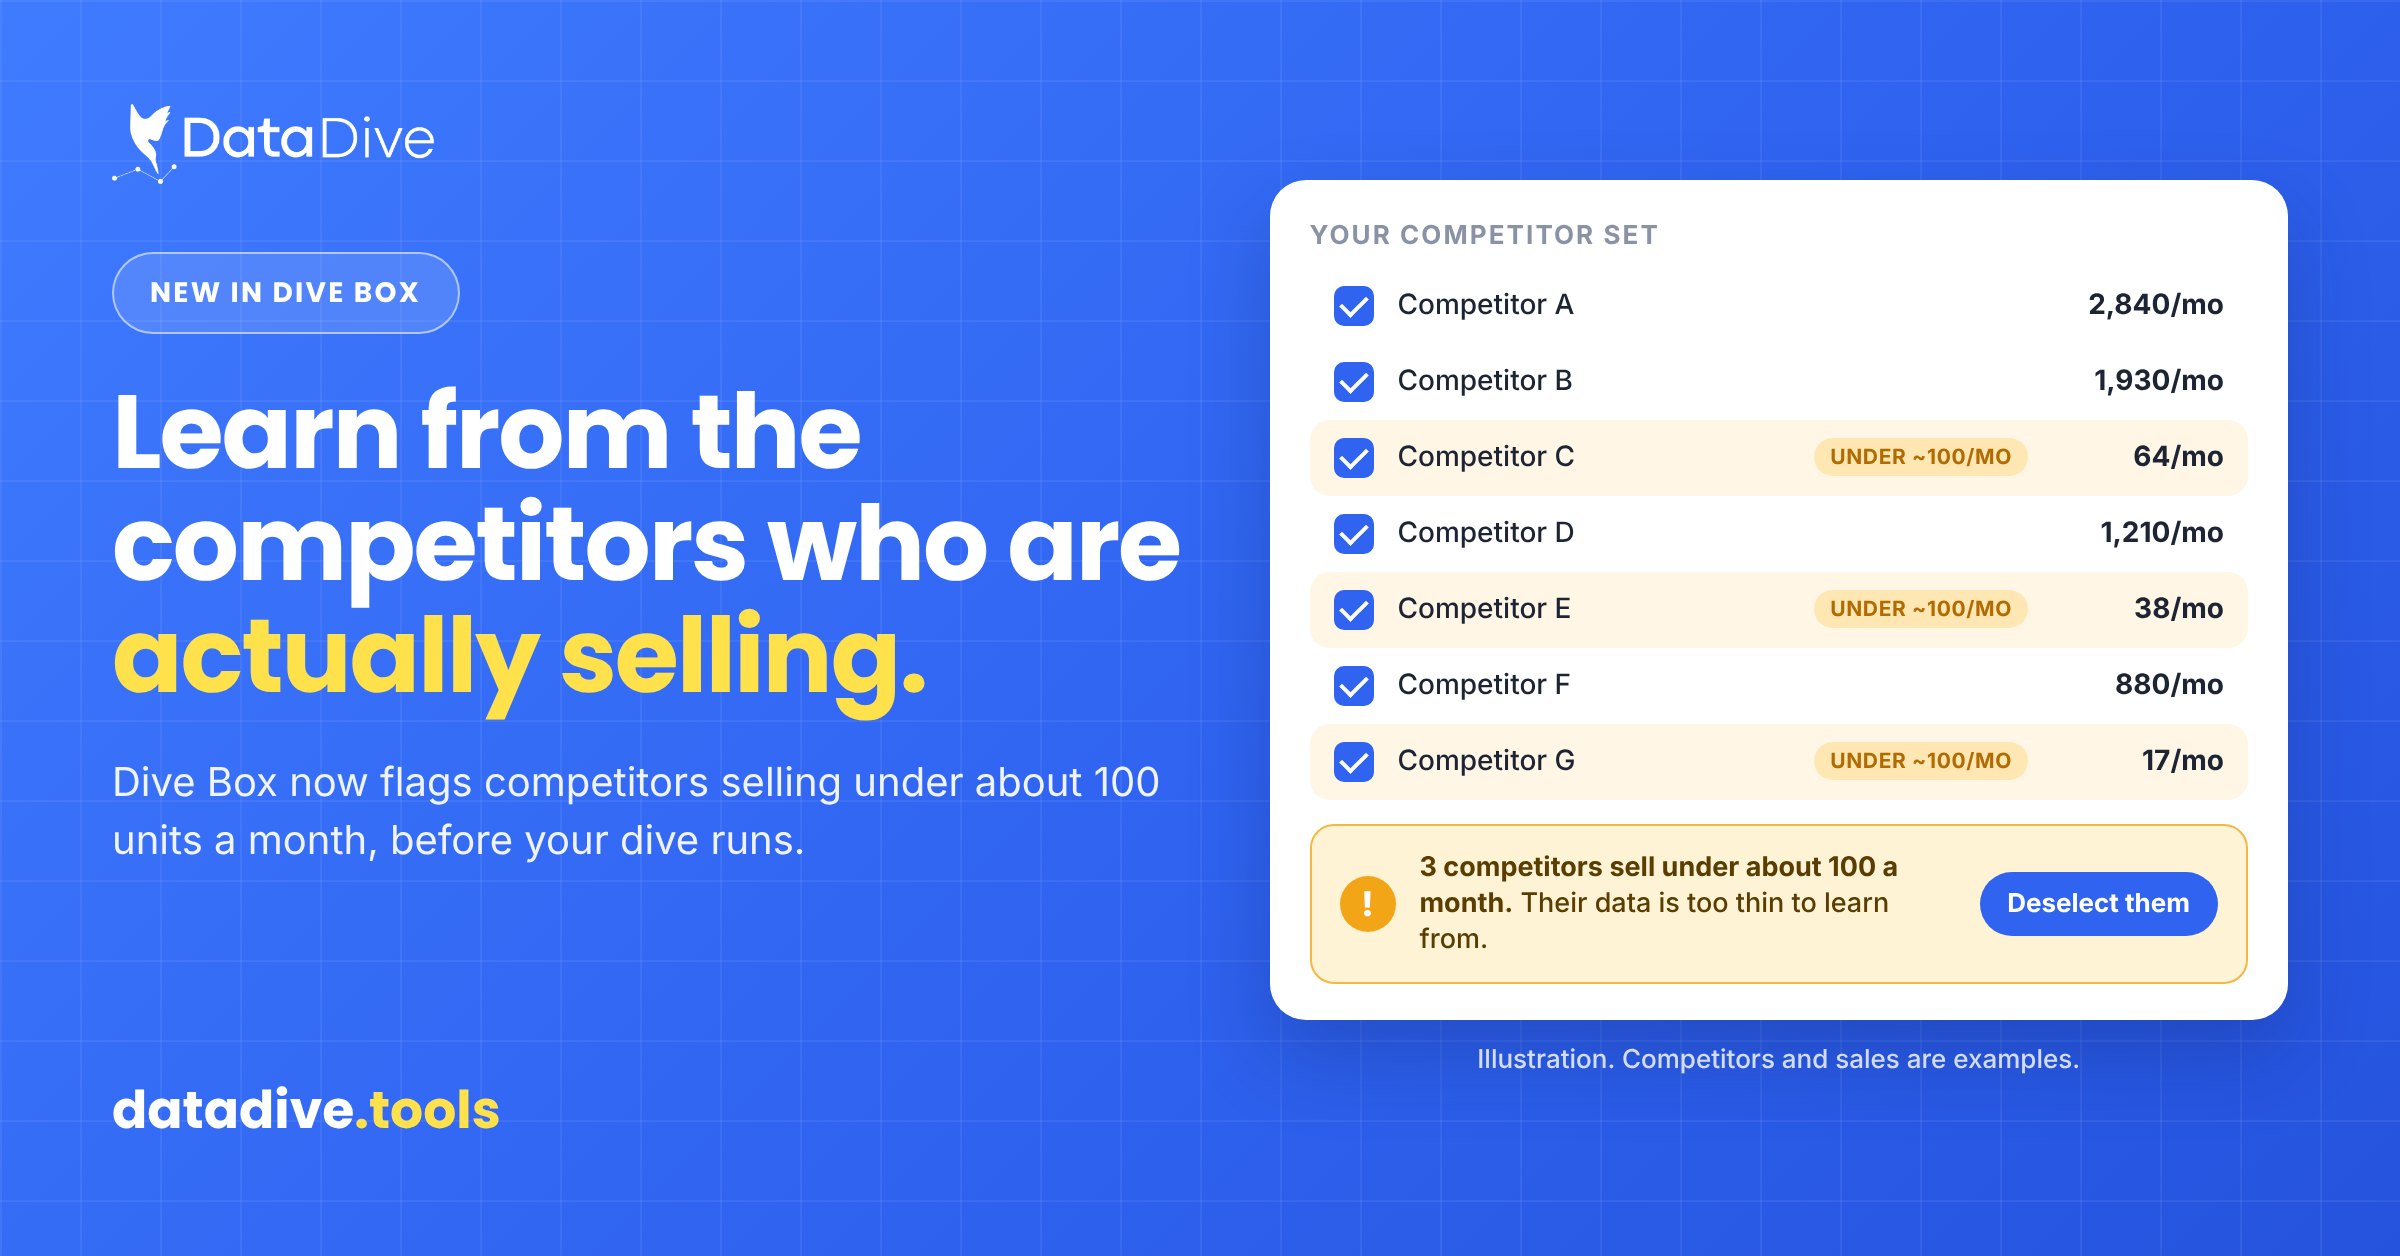
Learn From the Competitors Who Are Actually Selling
Data Dive’s Dive Box now warns you about competitors selling under about 100 units a month before a dive runs, so you learn from the sellers who are actually selling.
Brandon Young
CEO and Co-founder, Data Dive
Most rank arguments I see are not really rank arguments. They are date range arguments.
Before deciding whether a product is winning or losing, make sure everyone is comparing the same window and reading the same context.
Use the same length, the same days where possible, and write down the important events that happened inside each comparison period.
Then read rank together with demand and spend, and repeat the same comparison every week.

Brandon Young presenting a repeatable operating process for conversion, indexing, and Amazon advertising.
One person pulls the last seven days. Another pulls the last thirty, and suddenly both people see completely different performance stories.
One window might include a promotion weekend, stock problem, listing edit, advertising push, or price change while the other window does not.
Both people can be looking at accurate numbers while reaching opposite conclusions about whether the product is gaining or losing ground.
Then the team starts arguing about the numbers instead of fixing the product. That is a process problem, and it is fixable.
My process has not changed in a decade. Data comes first, followed by the opportunity or risk and a repeatable process.
After that, automate, measure, and improve. Data first only works when everyone reads the same information in the same way.
Compare seven days against the seven days before it, or thirty days against the previous thirty days for a cleaner comparison.
Weekend demand and weekday demand can behave differently, so accidentally adding another weekend can materially change the averages you are comparing.
Record price changes, coupons, stockouts, listing edits, promotions, and large advertising pushes beside the ranking movement you are reviewing.
Organic rank shows where you appeared, SQP shows shopper activity, and PPC information shows what you paid to influence the result.
This is one reason we built Data Dive to connect ranking information with other marketplace signals instead of treating rank alone.
Data Dive tracks more than 3.9 million keywords every day across more than 58,000 Amazon ASINs on the platform.
Daily information becomes more useful when the comparison remains consistent enough for operators to understand what actually changed between periods.
Rank Radar lets users bring organic rank, impression rank, PPC information, and Search Query Performance into the same view.
A daily tracker read through mismatched windows is simply a faster way to reach the wrong conclusion.
The frequency of the data improves the opportunity to understand change, but consistency in the comparison determines whether the analysis is useful.
Our team shipped another round of improvements to the date range picker experience, and those changes are now available in production.
I am not going to oversell a picker. Nobody buys research software because they are excited about a date control.
Small controls still determine whether a team can repeat the same comparison every week without rebuilding the entire view from memory.
Rank Radar also lets users select the desired date range for the information displayed in the tracking view.
If you manage a brand or client portfolio, try the same review process for the next four weeks before adding complexity.
Use the same length as last Monday, then write down the three keywords that moved the most in either direction.
Review demand, advertising spend, listing changes, and inventory, then write the most likely explanation in one straightforward sentence.
Check whether the cause you identified still holds and whether the action you took produced the movement you expected.
That is it. No new dashboard and no opinion contest. Use the same window and answer the same questions every week.
Contribution dollars, ranking movement, and repeatability will tell you more over a month than one dramatic report tells you in a day.
Data does not remove judgment. It gives judgment something solid to stand on.
Compare like with like, and the data you already have will start making decisions much easier to explain and repeat.
Different date ranges can include different promotions, weekends, stock problems, advertising changes, or listing edits and therefore tell different stories.
Compare equal length windows, match weekdays where possible, record important events, and read ranking information with demand and advertising activity.
Organic rank shows visibility, SQP provides shopper behavior, and PPC information adds the paid activity that may have influenced those results.
Review the same window each Monday, identify three large keyword movements, investigate likely causes, then revisit only those keywords on Friday.
Data Dive Tracks More Than 3.9 Million Keywords Every Day: See how daily rank tracking connects with marketplace demand, advertising information, alerts, and connected workflows.
Color Blind Friendly Rank Colors: See how Rank Radar gives users another way to scan dense ranking information more comfortably.
Data Dive Indexing Alerts: Learn how Data Dive surfaces listing indexing problems before lost visibility becomes a larger performance issue.
Data Dive is the operating system for ecommerce sellers.
Built by operators who have sold on Amazon since 2015, Data Dive combines product research, keyword intelligence, daily organic rank tracking, Search Query Performance data, and advertising data.
Learn more at datadive.tools.
Data Dive’s Dive Box now warns you about competitors selling under about 100 units a month before a dive runs, so you learn from the sellers who are actually selling.
Data Dive now tracks more than 3.9 million keywords daily across 58,000+ ASINs, and connects rank, SQP, and PPC data to alerts, dashboards, and AI tools.